- Visibility 678 Views
- Downloads 50 Downloads
- Permissions
- DOI 10.18231/j.jmra.2022.013
-
CrossMark

Relationship between liquidity and profitability: An analysis of Indian cement companies
- Author Details:
-
 Harsheen Gill *
Abstract
The ultimate aim of working capital management is to enable a firm to maximize profits from its operations and to maintain enough liquidity at the same time. As liquidity and profitability are inversely related to each other, hence increasing profitability would tend to reduce firms’ liquidity and too much attention on liquidity would tend to affect the profitability. Though every firm tries to maximize the profitability by preserving the liquidity but, increasing profits at the cost of liquidity might cause serious trouble to the firm and this problem might lead to financial insolvency as well. Thus an effective balance between liquidity and profitability is very much required to achieve both of the objectives of every firm, i.e. liquidity and profitability. To increase profit, a firm need to forgo liquidity which might damage the firm’s goodwill, deteriorate firm’s credit standings and that might lead to forced liquidation of firm’s assets and excessive liquidity on the other hand indicates the accumulation of idle funds that don’t fetch any profits for the firm. Hence a study is very much required to understand how firms earn profit without compromising the liquidity. This study is an attempt to establish the relationship between the liquidity and profitability of top ten Indian cement companies. The data has been analyzed using Spearman's Rank Coefficient of Correlation and it is found that both liquidity and profitability is negatively correlated which confirms the theoretical viewpoint.
Introduction
Maintaining daily liquidity is the most important part of working capital management since it ensures the organization's ability to operate and pay its obligations. Consequently, it is important to keep an eye on the company's liquidity status, since it is essential for its survival. If a firm focuses too much on liquidity, it will have a negative impact on its capacity to generate profits. Every company, no matter how large or small, aims to increase profits while preserving liquidity. However, increasing earnings at the expense of liquidity might result in serious problems for the company, which could lead to financial disaster in the long run. Good working capital management would be required to achieve the company's two main objectives simultaneously. Insufficient liquidity may damage a business's goodwill, lower its credit rating, and even lead to the forced sale of the company's assets. On the one hand, excess liquidity refers to the buildup of idle money that does not create revenues for the organization. A healthy balance of liquidity and profitability is thus necessary, which is a subject of discussion since there is no clear definition of what constitutes a good balance?
Literature Survey
Several researchers have carried out studies related to liquidity, profitability, out of which a few of the prominent studies have revealed the following:
In their study, Shin and Soenen, (1998)[1] proved that efficient working capital management is very important to create value for the shareholders and profitability and liquidity are the salient goals of working capital management. For every organization, it is very much essential to manage its working capital successfully.
Eljelly (2004)[2] found out a negative relationship between profitability and liquidity in his study conducted by taking a sample of joint stock firms in Saudi Arabia. The study found that the cash conversion cycle was of more importance as a measure of liquidity than the current ratio that affects profitability. Moreover, the study also revealed that there was great variation among industries with respect to the significant measure of liquidity.
Raheman and Nasr (2006)[3] analyzed the working capital management and its effect on liquidity as well as on profitability of the sample firms. They found that there is a significant negative relationship between liquidity and profitability. They also found that there is a positive relationship between size of the firm and its profitability. There is also a significant negative relationship between debt used by the firm and profitability.
Panigrahi (2013)[4] conducted a comparative study of the liquidity positions of five top Indian cement companies in order to determine the companies' liquidity positions for a period of ten years from 2000-2001 to 2009-2010. The author employed methods such as mean, standard deviation, and coefficient of variation, ratio analysis, and Motaal's ultimate rank test. It has been found that small firms have stronger liquidity than big firms, and the growth rates of current ratios, quick ratios, and working capital to current assets are all negative, suggesting a poor liquidity position. The author concludes that, spending less on current assets which is known as aggressive working capital management strategy may produce a higher rate of return but aggressive working capital tactics also increases the risk of default and bankruptcy.
In (2018)[5], Panigrahi, Raul and Gijare conducted a study to find out the relationship between liquidity and profitability for a period of five years from 2011-12 to 2015-16 for five selected pharmaceutical companies. It is found that the liquidity position of Biocon is best among all the five companies as per Motaal's test of liquidity. The techniques of Motaal's ultimate rank test have been applied to analyze the data. The researchers attempted to study the association between liquidity and profitability of the sample companies by using Spearman's Rank Coefficient of Correlation. The results found were the same as the theoretical views i.e. both are negatively correlated.
Scope of The Study
The present study conducted by collecting the information of top ten Indian cement companies namely, UltraTech Cement, Shree Cement, Ambuja Cement, ACC, J.K. Cement, Ramco, Birla Corporation, JK Lakshmi, Rain Industries, and India Cement, UltraTech Cement, Shree Cement, Ambuja Cement, ACC, J.K. Cement, Ramco, Birla Corporation, JK Lakshmi, Rain Industries, India Cement and UltraTech for a period of five years from 2016-17 to 2020-21. The required information is collected from company websites and moneycontrol.com.
Research Methodology
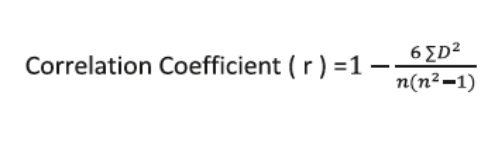
Although liquidity and profitability are mutually exclusive words, neither can exist without the other. In any event, having too much of one might be harmful to the other. Profitability and liquidity should be preserved through management. The authors used the distinguishing features to evaluate the profitability and liquidity position of ten cement enterprises. Current assets and total assets are used to determine profitability; the total assets ratio is used to analyze liquidity and profits for capital used.[6], [7], [8], [9], [3], [1] The’t’ test is used to assess the concept and attain outcomes, while Spearman's Rank Correlation is employed to find out the relationship between profitability and liquidity. The following formula of correlation coefficient is employed as Spearman's Rank Correlation Coefficient to investigate the connection between Current Assets to Total Assets Ratio (CTTR) and Return on Capital Employed (ROCE) to see whether there is a link between liquidity and profitability, which is depicted in the tables provided below.
|
FY Year |
Current assets(Rs.) |
Total assets (Rs.) |
Capital employed (Rs.) |
EBIT (Rs.) |
CTTR (%) |
Rank (R1) |
ROCE (%) |
RANK (R2) |
D |
D^2 |
r |
t |
|
2017 |
13325.67 |
42218.90 |
33890.29 |
4512.14 |
31.56 |
1 |
13.31 |
2 |
-1 |
1 |
0.80 |
2.3 |
|
2018 |
11461.31 |
57150.52 |
45635.08 |
4539.20 |
20.05 |
3 |
9.95 |
4 |
-1 |
1 |
||
|
2019 |
12954.24 |
76537.43 |
61004.18 |
5245.77 |
16.93 |
5 |
8.60 |
5 |
0 |
0 |
||
|
2020 |
14721.46 |
79219.79 |
62639.21 |
7175.60 |
18.58 |
4 |
11.46 |
3 |
1 |
1 |
||
|
2021 |
24050.29 |
86183.51 |
65591.79 |
9341.11 |
27.91 |
2 |
14.24 |
1 |
1 |
1 |
|
FY Year |
Current assets (Rs.) |
Total assets (Rs.) |
Capital employed (Rs.) |
EBIT (Rs.) |
CTTR (%) |
Rank (R1) |
ROCE (%) |
RANK (R2) |
D |
D^2 |
r |
t |
|
2017 |
3282.19 |
11165.98 |
9176.96 |
1660.20 |
29.39 |
5 |
18.09 |
2 |
3 |
9 |
0 |
0.0 |
|
2018 |
5700.25 |
15141.67 |
12174.52 |
1962.40 |
37.65 |
3 |
16.12 |
3 |
0 |
0 |
||
|
2019 |
4719.22 |
15493.05 |
13366.47 |
1393.50 |
30.46 |
4 |
10.43 |
5 |
-1 |
1 |
||
|
2020 |
7893.82 |
19944.15 |
15928.59 |
2225.69 |
39.58 |
1 |
13.97 |
4 |
-3 |
9 |
||
|
2021 |
8187.33 |
21513.17 |
17812.36 |
3255.37 |
38.06 |
2 |
18.28 |
1 |
1 |
1 |
|
FY Year |
Current assets (Rs.) |
Total assets (Rs.) |
Capital employed (Rs.) |
EBIT (Rs.) |
CTTR (%) |
Rank (R1) |
ROCE (%) |
RANK (R2) |
D |
D^2 |
r |
t |
|
2017 |
8288.16 |
32823.81 |
25415.68 |
2149.52 |
25.25 |
5 |
8.46 |
5 |
0 |
0 |
1 |
1 |
|
2018 |
11094.56 |
35512.92 |
26635.60 |
2960.74 |
31.24 |
4 |
11.12 |
3 |
1 |
1 |
||
|
2019 |
12406.85 |
37340.73 |
28946.47 |
3076.51 |
33.23 |
2 |
10.63 |
4 |
-2 |
4 |
||
|
2020 |
14319.01 |
40182.34 |
31112.03 |
4025.21 |
35.64 |
1 |
12.94 |
2 |
-1 |
1 |
||
|
2021 |
12804.83 |
39720.70 |
30460.30 |
4117.37 |
32.24 |
3 |
13.52 |
1 |
2 |
4 |
|
FY Year |
Current assets(Rs.) |
Total assets (Rs.) |
Capital employed (Rs.) |
EBIT (Rs.) |
CTTR (%) |
Rank (R1) |
ROCE (%) |
RANK (R2) |
D |
D^2 |
r |
t |
|
2017 |
4069.64 |
13386.53 |
9335.35 |
874.23 |
30.40 |
5 |
9.36 |
5 |
0 |
0 |
0 |
1 |
|
2018 |
5654.92 |
14845.74 |
10053.08 |
1397.67 |
38.09 |
4 |
13.90 |
3 |
1 |
1 |
||
|
2019 |
6684.44 |
16055.95 |
11349.79 |
1587.56 |
41.63 |
3 |
13.99 |
2 |
1 |
1 |
||
|
2020 |
7534.57 |
17135.98 |
12437.75 |
2124.77 |
43.97 |
2 |
17.08 |
1 |
1 |
1 |
||
|
2021 |
8448.63 |
18200.23 |
13395.97 |
1757.00 |
46.42 |
1 |
13.12 |
4 |
-3 |
9 |
|
FY Year |
Current assets(Rs.) |
Total assets (Rs.) |
Capital employed (Rs.) |
EBIT (Rs.) |
CTTR (%) |
Rank (R1) |
ROCE (%) |
RANK (R2) |
D |
D^2 |
r |
t |
|
2017 |
1479.26 |
6410.87 |
5130.11 |
588.28 |
23.07 |
5 |
11.47 |
5 |
0 |
0 |
1 |
1.7 |
|
2018 |
1684.45 |
6456.01 |
5146.39 |
667.31 |
26.09 |
4 |
12.97 |
3 |
1 |
1 |
||
|
2019 |
2045.44 |
7412.66 |
5802.89 |
673.55 |
27.59 |
2 |
11.61 |
4 |
-2 |
4 |
||
|
2020 |
2234.57 |
8542.03 |
6717.34 |
995.57 |
26.16 |
3 |
14.82 |
2 |
1 |
1 |
||
|
2021 |
3183.10 |
9871.98 |
7914.62 |
1345.45 |
32.24 |
1 |
17.00 |
1 |
0 |
0 |
|
FY Year |
Current assets(Rs.) |
Total assets (Rs.) |
Capital employed (Rs.) |
EBIT (Rs.) |
CTTR (%) |
Rank (R1) |
ROCE (%) |
RANK (R2) |
D |
D^2 |
r |
t |
|
2017 |
1421.78 |
7070.51 |
5045.03 |
961.79 |
20.11 |
1 |
19.06 |
1 |
0 |
0 |
1 |
1.7 |
|
2018 |
1300.42 |
7158.02 |
5301.59 |
851.27 |
18.17 |
2 |
16.06 |
2 |
0 |
0 |
||
|
2019 |
1380.51 |
8203.79 |
6136.24 |
769.49 |
16.83 |
3 |
12.54 |
4 |
-1 |
1 |
||
|
2020 |
1575.71 |
10132.76 |
7796.44 |
864.38 |
15.55 |
4 |
11.09 |
5 |
-1 |
1 |
||
|
2021 |
1458.91 |
11454.92 |
9035.55 |
1231.12 |
12.74 |
5 |
13.63 |
3 |
2 |
4 |
|
FY Year |
Current assets(Rs.) |
Total assets (Rs.) |
Capital employed (Rs.) |
EBIT (Rs.) |
CTTR (%) |
Rank (R1) |
ROCE (%) |
RANK (R2) |
D |
D^2 |
r |
t |
|
2017 |
2094.84 |
9697.82 |
8453.66 |
507.09 |
21.60 |
4 |
6.00 |
4 |
0 |
0 |
0 |
-1 |
|
2018 |
2454.05 |
11074.94 |
9486.17 |
537.48 |
22.16 |
1 |
5.67 |
5 |
-4 |
16 |
||
|
2019 |
2504.51 |
11331.61 |
9546.46 |
687.96 |
22.10 |
3 |
7.21 |
3 |
0 |
0 |
||
|
2020 |
2693.94 |
12175.47 |
10075.39 |
1069.19 |
22.13 |
2 |
10.61 |
1 |
1 |
1 |
||
|
2021 |
2668.08 |
12895.59 |
10870.79 |
1008.87 |
20.69 |
5 |
9.28 |
2 |
3 |
9 |
|
FY Year |
Current assets(Rs.) |
Total assets (Rs.) |
Capital employed (Rs.) |
EBIT (Rs.) |
CTTR (%) |
Rank (R1) |
ROCE (%) |
RANK (R2) |
D |
D^2 |
r |
t |
|
2017 |
1118.75 |
5131.75 |
3802.03 |
323.86 |
21.80 |
3 |
8.52 |
4 |
-1 |
1 |
1 |
1.7 |
|
2018 |
1077.27 |
5101.08 |
3603.29 |
296.23 |
21.12 |
4 |
8.22 |
5 |
-1 |
1 |
||
|
2019 |
1009.98 |
5065.63 |
3512.47 |
304.34 |
19.94 |
5 |
8.66 |
3 |
2 |
4 |
||
|
2020 |
1255.71 |
5162.80 |
3460.74 |
593.99 |
24.32 |
2 |
17.16 |
2 |
0 |
0 |
||
|
2021 |
1481.98 |
5286.23 |
3802.57 |
748.04 |
28.03 |
1 |
19.67 |
1 |
0 |
0 |
|
FY Year |
Current assets(Rs.) |
Total assets (Rs.) |
Capital employed (Rs.) |
EBIT (Rs.) |
CTTR (%) |
Rank (R1) |
ROCE (%) |
RANK (R2) |
D |
D^2 |
r |
t |
|
2017 |
5246.61 |
15823.07 |
13179.43 |
1451.28 |
33.16 |
1 |
11.01 |
1 |
0 |
0 |
1 |
4 |
|
2018 |
4372.70 |
16227.74 |
14036.98 |
1043.13 |
26.95 |
4 |
7.43 |
5 |
-1 |
1 |
||
|
2019 |
4372.70 |
16227.74 |
14036.98 |
1043.14 |
26.95 |
4 |
7.43 |
4 |
0 |
0 |
||
|
2020 |
4981.75 |
18281.16 |
15709.96 |
1340.51 |
27.25 |
2 |
8.53 |
3 |
-1 |
1 |
||
|
2021 |
4981.75 |
18281.16 |
15709.96 |
1340.52 |
27.25 |
2 |
8.53 |
2 |
0 |
0 |
|
FY Year |
Current assets(Rs.) |
Total assets (Rs.) |
Capital employed (Rs.) |
EBIT (Rs.) |
CTTR (%) |
Rank (R1) |
ROCE (%) |
RANK (R2) |
D |
D^2 |
r |
t |
|
2017 |
1948.23 |
10949.71 |
8513.55 |
631.52 |
17.79 |
4 |
7.42 |
1 |
3 |
9 |
-1 |
-2.3 |
|
2018 |
1968.19 |
10977.52 |
9041.97 |
454.50 |
17.93 |
3 |
5.03 |
3 |
0 |
0 |
||
|
2019 |
2331.45 |
11300.26 |
8791.96 |
400.18 |
20.63 |
1 |
4.55 |
4 |
-3 |
9 |
||
|
2020 |
2382.36 |
11669.62 |
8791.77 |
366.80 |
20.42 |
2 |
4.17 |
5 |
-3 |
9 |
||
|
2021 |
1838.37 |
11089.95 |
8510.54 |
581.67 |
16.58 |
5 |
6.83 |
2 |
3 |
9 |
Proposed Hypothesis
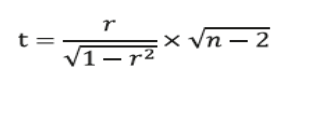
Null Hypothesis (H0): There is a negative relationship between the two variables, viz. Profitability and Liquidity.Alternative Hypothesis (H1): There is no negative relationship between the two variables, viz. Liquidity and profitability.The sample coefficient of correlation must be known before the hypothesis can be tested. The following formula may be used to get the appropriate‘t’ test statistic for this case.
Data Analysis & Findings
The following tables show the computed liquidity ratios, the amount invested in liquid assets, working capital, and other associated ratios for the chosen firms:
Summary of Findings and Managerial Implications
In this study, ten publicly traded cement businesses were analyzed from 2016-17 to 2020-21 to determine the relationship between liquidity and profitability for the period. Although the theory of finance predicts a negative association between liquidity and profitability which matches with our findings, it is seen that extraordinarily liquid companies also make money. Not all successful companies need liquidity and all lucrative enterprises are losing money. It's possible for a firm to grow without jeopardizing its ability to get capital.
When it comes to the ultimate trade-off between liquidity and profitability, it's all about finding the right balance. Despite the importance of this question, no one can agree on a solution or standard. The problem is that in today's corporate world, managing the show with negative working capital is seen to be a sign of management efficiency. However, all financial managers must guarantee that management’s efficiency does not lead to financial insolvency.
Conclusion and Recommendations
Working Capital Management (WCM) is a financial function that manages current assets and liabilities. It is the relationship between the existing assets and liabilities of a corporation. The everyday activities of a business must strike a balance between liquidity and profitability. The short-term commitments of company need liquidity and a lucrative endeavour may generate consistent cash flow. It should come as no surprise that cash is an important measure of financial well. Working capital management guarantees that a company can meet both short-term debt obligations and long-term operational requirements. Keeping track of commodities, receivables, payables, and cash is part of managing working capital.
Shree Cement has the best liquidity ratio of the ten firms analyzed. The study's other firms need to boost their liquidity. The companies in the research didn't have a good liquid/current ratio. Working capital was negative in numerous circumstances. To maximize capital returns and profitability, several businesses are increasingly operating with negative working capital. Negative working capital lowers working capital expenses (increases profitability), but it also indicates a cash shortage (stressed circumstance for the lenders and so forth). In a downturn, it may also be burdened with prior duties, which is negative. As a result, there should be a trade-off between profitability and liquidity.
It may be very advantageous if a company's cash flow is translated inside the same cycle. Borrowing may be required to meet ongoing working capital requirements. Profitability and liquidity must be balanced as a result. Current asset investments are unavoidable in order to secure eventual customer delivery of goods or services, and how these assets are managed has an influence on profitability and liquidity. The cash operating cycle will be extended if resources in the supply chain are interrupted. While more sales may increase profitability, the costs of storing additional inventory and/or providing more trade credit to customers may outweigh the advantages.
We recommend cement companies to estimate sales and have enough cash on hand when purchasing by paying cash to negotiate lower pricing. Profitability is boosted by effective working capital and liquidity management. According to this research, Indian cement companies might increase their profitability by better managing their working capital. Inventory management may help a company's profitability tremendously. As a result, this research reveals that when a firm manages its working capital and inventory more efficiently, its profitability increases. To summarize, the measures discussed above would undoubtedly assist the chosen firms in better managing their entire working capital. The chosen enterprises can maximize their potential and progress the country's economic development by properly managing their working capital.
Source of Funding
None.
Conflict of Interest
None.
References
- Shin HH, Soenen L. Efficiency of Working Capital Management and Corporate Profitability. Financial Pract Educ. 1998;8(2):37-45. [Google Scholar]
- Eljelly AMA. Liquidity - profitability tradeoff: An empirical investigation in an emerging market. Int J Commerce Manag. 2004;14(2):48-61. [Google Scholar]
- Raheman A, Nasr M. Working capital management and profitability - Case of Pakistani firms, International review of business research papers. Int Rev Business Res Papers. 2007;3(1):279-300. [Google Scholar]
- Panigrahi A. Liquidity Management of Indian Cement Companies - A Comparative Study. J Business Manag. 2013;14(5):49-61. [Google Scholar] [Crossref]
- Panigrahi A, NR. Liquidity and Profitability Trade-Off: A Study of Indian Pharmaceutical Companies. J Econ Public Policy. 2018;3(1):42-56. [Google Scholar]
- Panigrahi A. Relationship of Working Capital with Liquidity, Profitability and Solvency: A Case Study of ACC Limited. J Manag Res. 2014;4(2):308-22. [Google Scholar]
- Panigrahi A. Understanding the Working Capital Financing Strategy (A Case Study of Lupin Limited). J Manag Res Anal. 2014;1(1):108-20. [Google Scholar]
- Panigrahi A. Validity of Altman’s ‘Z’ Score Model in Predicting Financial Distress of Pharmaceutical Companies. J Econ Public Policy. 2019;4(1):65-73. [Google Scholar]
- Panigrahi A. Working Capital Management Efficiency of Indian Cement Industry. J Econ Public Policy. 2017;2(1):8-28. [Google Scholar]