- Visibility 105 Views
- Downloads 21 Downloads
- Permissions
- DOI 10.18231/j.jmra.2022.024
-
CrossMark

Abstract
Prediction method are the methods performed on a data set either to foresee the reaction variable worth in view of an indicator variable or to concentrate on the connection between the reaction variable and the indicator factors. With the help of prediction, it will assist any organisation whether it is corporate or academic for the future retention rate of the employees and the grey area on which the organisations has to focus on rectification of employees concerned problems to increase the loyalty rate. Purpose of this paper is to explain the various techniques which are available presently for predicting or forecasting. This paper also explains about various prediction techniques and also provide insights about these techniques which are available for finding employee retention.
Introduction
Modern research associated with retention of employee are emerging issues in contemporary corporate world. The chief issue lies in the management of essential workforce is broad and is presumably going to present troubles to different organisations in the near future. Corporate houses are presumably going to conform to the various designs of definitive approach to acting concerning the genuine elements of the continuous work environment, whose accomplishment additionally, life range relies upon creativity, innovativeness, and versatility. Employee retention approach is a complex way of thinking.
The human asset in each company is seen to be the alone parameter for upper hand advantage and the most important resource in each corporate houses. For each company, skilled workers are the spine. Hence, corporate houses need to address current difficulties by giving preparation of training to the representatives so that they can help to achieve the goals of the corporates.
Literature Review
S. Lai, et. al.[1], [2], [3], [4], [5], [6], [7], [8] have proposed the setting based data grouping; RCNN is exceptionally valuable. The execution is best in a few datasets especially on report level datasets. Contingent upon the words utilized in the sentences, loads are alloted to it and are pooled into least, normal and the maximum pools. Here, at the most pooling is applied to separate the catchphrases from the sentences which are generally significant. RNN, CNN and RCNN when contrasted and other conventional strategies, for example, LDA, Tree Kernel and calculated relapse creates high precise outcomes. A. Hassa, et. al.[9] have proposed RNN for the construction sentence portrayal. This tree like construction catches the semantic of the sentences. The text is investigated word by word by utilizing RNN then the semantic of every one of the past texts are safeguarded in a decent size stowed away layer. For the proposed framework LSTM plays significant job, being a memory stockpiling it holds the characters which helps in foreseeing the following word. J. Y. Lee, et. al.[7] have suggested that text arrangement is a significant assignment in normal language handling. Many methodologies have been created for arrangement like SVM (Support Vector Machine), Naïve Bayes etc. Normally short message shows up in grouping (sentences in the record) thus utilizing data from going before text might work on the characterization. This paper presented RNN (Recurrent Neural Network) and CNN (Convolutional Neural Network) based model for text characterization. V. Tran, et. al.[5] have recommended that n-gram is a coterminous grouping of 'n' things from a given succession of text. Assuming the given sentence is 'S’, we can build a rundown on n-grams from 'S', by tracking down sets of words that happens close to one another. The model is utilized to infer likelihood of sentences utilizing the chain rule of unqualified likelihood. Z. Shi, et. al.[4] have characterized that repetitive brain network has information, yield and secret layer. The current secret layer is determined by current info layer and past secret layer. LSTM is a unique Recurrent Neural Network. The rehashing module of common RNN has a basic construction rather LSTM utilizes more complicated capability to trade it for more exact outcome. The vital component in the LSTM is the cell state which is moreover called as covered up layer state. J. Shin, et. al.[10] have characterized that understanding the relevant parts of a sentence is vital while its characterization. This paper mostly centers around it. Different methodologies like SVM, T-LSTM, and CNN have been recently utilized for sentence characterization. However, the proposed C-CNN (Contextual-CNN) gives improved results for example the C-CNN accomplishes condition of-theart exactness 52.3% on the fine-grained opinion forecast task and 95.2% on the TREC question arrangement task. W. Yin, et. al.[11] have characterized different grouping undertakings are significant for Natural language handling applications. These days CNN are expanding utilized as they can show long reach conditions in sentence, the frameworks utilized are with fixed-sized channels. Yet, the proposed MVCNN approach breaks this boundary furthermore, yields improved results when applied to different datasets: twofold with 89.4%, Sentiment 140 with 88.2% and Subjectivity grouping dataset (Subj.) with 93.9% exactness. Multichannel instatement brings two benefits: 1) Frequent words can have c portrayals to start with (rather than only one), and that would not joke about this has more accessible data to use 2) An uncommon word missed in some implanting renditions can be "made up" by others (we refer to it as "to some extent known word"). I. Sutskever, et. al.[12] have characterized profound getting the hang of being the freshest innovation in the period has progressed in many fields. One of the procedures called as Deep Neural Networks are extremely strong AI models what's more, have accomplished effective and astounding execution on numerous issues like discourse acknowledgment, visual article location and so on because of its capacity to perform equal calculation for the unassuming no of steps. Many endeavors have been made to resolve the issues with brain organization. The outcomes showed that an enormous profound LSTM with a restricted jargon can outflank a standard SMT-based framework.
Problem of the study
Finding the methods for prediction of employee retention and their suitability in organisation.
Objective of the study
Following are the objectives of the study.
To find the methods for employee retention.
To check the analytical part of each method.
Tools and techniques for study
There were various prediction techniques. Need of Employee Prediction Method can be explained by following points.
Overseeing labour force: If the bosses or HR came to be aware of a representative that they will intend to leave the organization then they could reach out to those workers which can assist them with remaining back or they can deal with the labour force by recruiting the new option of those representatives.
Consistent Workforce: If every one of the representatives in the ongoing task are working consistently on a venture then the pipeline of that undertaking will be smooth yet on the off chance that guess one proficient resource of the project (employee) unexpectedly leave that organization the work process will be not really smooth.
Recruiting Management: If HR of one specific task came to be familiar with the representative who will leave the organization then he/she can deal with the quantity of employing and they can get the significant resource at whatever point they need so for the proficient progression of work.
Some of the best techniques which has been used for study are:
Regression Analysis
Regression analysis is utilized to anticipate a ceaseless objective variable from one or different autonomous factors. Commonly, regression investigation is utilized with normally happening factors, instead of factors that have been controlled through trial and error.
ANOVA
ANOVA, or investigation of fluctuation, is to be utilized when the objective variable is persistent and the reliant variables are category wise. The null hypothesis in this examination is that there is no huge distinction between the various groupings. The populace ought to be typically circulated, the example cases ought to be free of one another, and the variables ought to be roughly equivalent among the gatherings. Below [Table 1] shows the example of ANOVA.
|
Anxiety Level |
|||||
|
Work culture |
Sum of Squares |
df |
Mean Square |
F |
Sig. |
|
Between Groups |
13.7 |
5 |
3.42 |
3.3 |
0.01 |
|
Within Groups |
151.0 |
145 |
1.04 |
|
|
|
Total |
164.7 |
150 |
|
|
|
Linear Regression
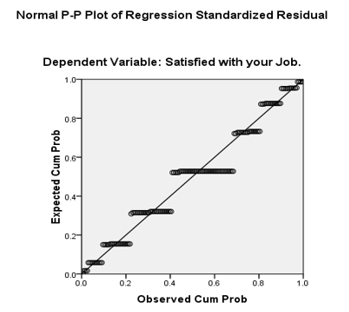
Linear regression is to be utilized when the objective variable is nonstop and the dependent variable is constant or a combination of ceaseless and unmitigated, and the connection between the autonomous variable and dependent variables are straight. Besides, all the indicator factors ought to be regularly circulated with consistent fluctuation and ought to exhibit almost no multi collinearity nor autocorrelation with each other. Linear regression calculations of prediction is better explained in [Table 1], [Table 2] along with [Figure 1].
|
Residuals Statistics |
|||||
|
|
Minimum |
Maximum |
Mean |
Std. Deviation |
N |
|
Predicted Value |
1.4287 |
3.4592 |
2.1800 |
.54766 |
150 |
|
Residual |
-2.45918 |
2.06365 |
.00000 |
.91758 |
150 |
|
Std. Predicted Value |
-1.372 |
2.336 |
.000 |
1.000 |
150 |
|
Std. Residual |
-2.671 |
2.241 |
.000 |
.997 |
150 |
|
a. Dependent Variable: Satisfied with your Job. |
|
|
Logistic regression doesn't need a straight connection between the objective and the dependent variables. The objective variable is paired (accepts a value of 0 or 1) or dichotomous. The residuals/errors of a logistic regression need not be regularly distributed and the change of the residuals needn't bother with to be consistent. Nonetheless, the dependent variables are parallel, the perceptions should be autonomous of one another, there should be almost no multi collinearity nor autocorrelation in the information, and the sample size ought to be enormous. Finally, while this investigation doesn't need the dependent and independent variable(s) to be directly related, the independent variables should be straight connected with the log chances. Logistic regression calculations of prediction is better explained in [Table 3], [Table 4], [Table 5], [Table 6], [Table 7], [Table 8], [Table 9], [Table 10], [Table 11], [Table 12], [Table 13] along with [Figure 2].
|
Unweighted Cases a |
N |
Percent |
|
|
Selected Cases |
Included in Analysis |
150 |
100.0 |
|
Missing Cases |
0 |
.0 |
|
|
Total |
150 |
100.0 |
|
|
Unselected Cases |
0 |
.0 |
|
|
Total |
150 |
100.0 |
|
|
a. If weight is in effect, see classification table for the total number of cases. |
|
Dependent variable encoding |
|
|
Original Value |
Internal Value |
|
Male |
0 |
|
Female |
1 |
|
Classification Tablea,b |
|||||
|
|
Observed |
Predicted |
|||
|
|
What is your Gender? |
Percentage Correct |
|||
|
Male |
Female |
||||
|
Step 0 |
What is your Gender? |
Male |
82 |
0 |
100.0 |
|
Female |
68 |
0 |
.0 |
||
|
Overall Percentage |
|
|
54.7 |
||
|
a. Constant is included in the model. |
|
|
|
||
|
b. The cut value is .500 |
|
|
|
|
|
Variables in the Equation |
|||||||
|
|
|
B |
S.E. |
Wald |
df |
Sig. |
Exp(B) |
|
Step 0 |
Constant |
-.187 |
.164 |
1.303 |
1 |
.254 |
.829 |
|
|
|
|
Score |
df |
Sig. |
|
Step 0 |
Variables |
Job |
1.243 |
1 |
.265 |
|
Stress |
.301 |
1 |
.583 |
||
|
Overall Statistics |
2.223 |
2 |
.329 |
|
Omnibus Tests of Model Coefficients |
||||
|
|
|
Chi-square |
df |
Sig. |
|
Step 1 |
Step |
2.249 |
2 |
.325 |
|
Block |
2.249 |
2 |
.325 |
|
|
Model |
2.249 |
2 |
.325 |
|
Model Summary |
|||
|
Step |
-2 Log likelihood |
Cox & Snell R Square |
Nagelkerke R Square |
|
1 |
204.386a |
.015 |
.020 |
|
a. Estimation terminated at iteration number 3 because parameter estimates changed by less than .001. |
|
Step |
Chi-square |
df |
Sig. |
|
1 |
9.508 |
7 |
.218 |
|
Contingency table for hosmer and lemeshow test |
||||||
|
What is your Gender? = Male |
What is your Gender? = Female |
Total |
||||
|
Observed |
Expected |
Observed |
Expected |
|||
|
Step 1 |
1 |
9 |
9.915 |
6 |
5.085 |
15 |
|
2 |
8 |
7.835 |
5 |
5.165 |
13 |
|
|
3 |
13 |
11.216 |
6 |
7.784 |
19 |
|
|
4 |
6 |
7.986 |
8 |
6.014 |
14 |
|
|
5 |
13 |
9.884 |
5 |
8.116 |
18 |
|
|
6 |
5 |
7.978 |
10 |
7.022 |
15 |
|
|
7 |
15 |
11.665 |
8 |
11.335 |
23 |
|
|
8 |
8 |
8.841 |
10 |
9.159 |
18 |
|
|
9 |
5 |
6.679 |
10 |
8.321 |
15 |
|
Observed |
Predicted |
||||
|
What is your Gender? |
Percentage Correct |
||||
|
Male |
Female |
||||
|
Step 1 |
What is your Gender? |
Male |
69 |
13 |
84.1 |
|
Female |
48 |
20 |
29.4 |
||
|
Overall Percentage |
59.3 |
||||
|
a. The cut value is .500 |
|
Variables in the Equation |
|||||||
|
S. E. |
Wald |
df |
Sig. |
Exp (B) |
|||
|
Step 1a |
Job |
-.232 |
.168 |
1.902 |
1 |
.168 |
.793 |
|
Stress |
.168 |
.169 |
.987 |
1 |
.321 |
1.183 |
|
|
Constant |
-.069 |
.457 |
.023 |
1 |
.880 |
.933 |
|
|
a. Variable(s) entered on step 1: Job, Stress. |

Ridge Regression
Ridge regression is a method for breaking down multiple regression variables resultant in multi collinearity. Ridge regression adopts the common least squares strategy, and respects that the residuals experience high differences by adding a level of predisposition to the regression estimates to lessen the standard mistakes. The suspicions follow those of multiple regression, the dissipate plots should be straight, there should be consistent change without any anomalies, and the dependent variables should display freedom.
|
Fit Statistic |
Mean |
SE |
Minimum |
Maximum |
Percentile |
||||||
|
5 |
10 |
25 |
50 |
75 |
90 |
95 |
|||||
|
Stationary R-squared |
.207 |
. |
.207 |
.207 |
.207 |
.207 |
.207 |
.207 |
.207 |
.207 |
.207 |
|
R-squared |
.254 |
. |
.254 |
.254 |
.254 |
.254 |
.254 |
.254 |
.254 |
.254 |
.254 |
|
RMSE |
.933 |
. |
.933 |
.933 |
.933 |
.933 |
.933 |
.933 |
.933 |
.933 |
.933 |
|
MAPE |
41.891 |
. |
41.891 |
41.891 |
41.891 |
41.891 |
41.891 |
41.891 |
41.891 |
41.891 |
41.891 |
|
MaxAPE |
191.250 |
. |
191.250 |
191.250 |
191.250 |
191.250 |
191.250 |
191.250 |
191.250 |
191.250 |
191.250 |
|
MAE |
.716 |
. |
.716 |
.716 |
.716 |
.716 |
.716 |
.716 |
.716 |
.716 |
.716 |
|
MaxAE |
2.865 |
. |
2.865 |
2.865 |
2.865 |
2.865 |
2.865 |
2.865 |
2.865 |
2.865 |
2.865 |
|
Normalized BIC |
-.006 |
. |
-.006 |
-.006 |
-.006 |
-.006 |
-.006 |
-.006 |
-.006 |
-.006 |
-.006 |
|
Specifications |
Growing Method |
CHAID |
|
Dependent Variable |
Satisfied with your Job. |
|
|
Independent Variables |
How many years you have been with the College/University?, Under which department do you work., Personnel policies of college., There is a good communication between Authority to Teaching Faculty., I feel like i am part of my college, Job Evaluation System of Faculty., Faculty Development Programme help the faculty to raise their teaching., What is your Gender?, What is Your Age?, You are working in:, College or University name., Name of respondent(optional), Academic Status, You are serving as:, Head of Department guiding me in developing my career., College/University following the UGC and AICTE norms., Stress level of Faculty is high., Are you getting sufficient opportunity for your career growth?, Performance appraisal system of your college., Grievance management & dispute resolution system of your college., Planning made by employers regarding employess future saving., Retirement Plan provided by the college., The vacation time you receive., How satisfied are you with salary?, Medical Facility provided by the college., Process used for promotion., Students are well prepared for my courses regarding subject knowledge., Students understand my lecture well enough and to write papers., College library gives my students enough access to textbooks and other books., Policy of Earned Leave., Policy of Academic Leave., Policy of H.R.A., Work culture in the College/ University., Things that my College/University should do to make it a better place for work., Feeling Job Security in the College/University., Appreciated by the College/University for good work. |
|
|
Validation |
None |
|
|
Maximum Tree Depth |
3 |
|
|
Minimum Cases in Parent Node |
100 |
|
|
Minimum Cases in Child Node |
50 |
|
|
Results |
Independent Variables Included |
College/University following the UGC and AICTE norms. |
|
Number of Nodes |
3 |
|
|
Number of Terminal Nodes |
2 |
|
|
Depth |
1 |
|
Estimate |
Std. Error |
|
.413 |
.040 |
|
Growing method: CHAID dependent variable: Satisfied with your Job. |
|
Observed |
Predicted |
|||||
|
Strongly Satisfied. |
Satisfied Some what. |
Neutral |
Dissatisfied Some what. |
Strongly Dissatisfied. |
Percent Correct |
|
|
Strongly Satisfied. |
37 |
6 |
0 |
0 |
0 |
86.0% |
|
Satisfied Somewhat. |
11 |
51 |
0 |
0 |
0 |
82.3% |
|
Neutral |
2 |
24 |
0 |
0 |
0 |
.0% |
|
Dissatisfied Somewhat. |
3 |
10 |
0 |
0 |
0 |
.0% |
|
Strongly Dissatisfied. |
0 |
6 |
0 |
0 |
0 |
.0% |
|
Overall Percentage |
35.3% |
64.7% |
.0% |
.0% |
.0% |
58.7% |
|
Growing Method: CHAID Dependent Variable: Satisfied with your Job. |
|
|
|
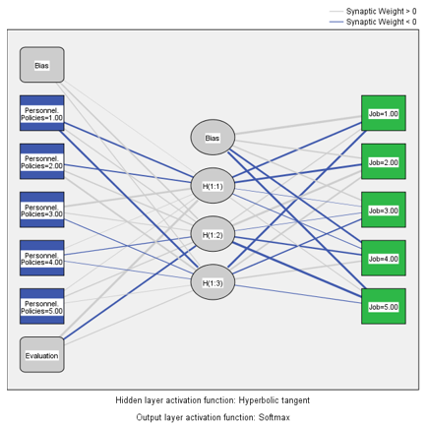
Input Layer |
Factors |
1 |
Personnel policies of college. |
|
Covariates |
1 |
Job Evaluation System of Faculty. |
|
|
Number of Unitsa |
6 |
||
|
Rescaling Method for Covariates |
Standardized |
||
|
Hidden Layer(s) |
Number of Hidden Layers |
1 |
|
|
Number of Units in Hidden Layer 1a |
3 |
||
|
Activation Function |
Hyperbolic tangent |
||
|
Output Layer |
Dependent Variables |
1 |
Satisfied with your Job. |
|
Number of Units |
5 |
||
|
Activation Function |
Softmax |
||
|
Error Function |
Cross-entropy |
||
|
a. Excluding the bias unit |
|
|
Time Series
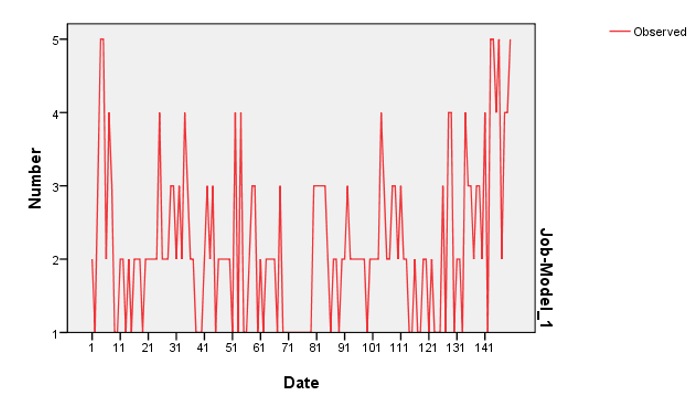
Time-series relapse investigation is a strategy for anticipating future reactions in light of reaction history. The information for a period series ought to be a bunch of perceptions on the qualities that a variable requires some investment. The information is bivariate and the independent variable is time. The series should be fixed, they are normally appropriated: the mean and change of the series are consistent throughout extensive period of time. Besides, the residuals ought to likewise be ordinarily circulated with a steady mean and variance throughout a significant period of time, as well as uncorrelated. The series shouldn't contain any exceptions. Assuming irregular shocks are available, they ought to be sure be randomly dispersed with a mean of 0 and a steady variance.[Table 14] along with [Figure 3] elaborate the prediction calculation of time series.
Decision Trees
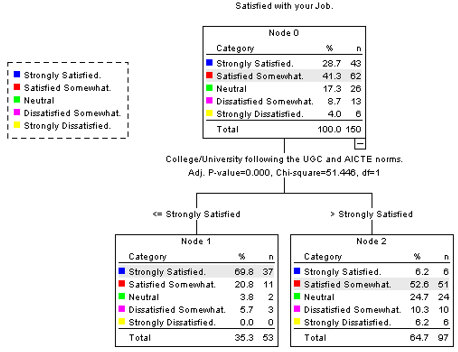
Decision trees are a sort of oversight learning algorithm calculation which more than once parts the sample in view of specific inquiries concerning the samples. These are extremely helpful for issues related with classification problems They are somewhat straightforward and exceptionally viable. Decision trees address a few choices followed by various possibilities of event. This procedure assists us with characterizing the main variables and the connection between at least two variables. [Table 15], [Table 16], [Table 17] along with [Figure 4] explains the calculations of decision tree model for prediction analysis.
Conclusion
Considering everything, these are just a little pack of the decisions of different insightful techniques that can be used to show data. It should be seen that making causal associations between factors when using judicious assessment procedures is very unsafe. We can't communicate that one variable caused one more in farsighted examination, rather, we can communicate that a variable impacted another and what that effect was.
Source of Funding
None.
Conflict of Interest
None.
References
- Lai S, Xu L, Liu K, Zhao J. Recurrent Convolutional Neural Networks for Text Classification. Proceedings of the Twenty-Ninth AAAI Conference on AI. 2015. [Google Scholar]
- Ongsulee P. Artificial Intelligence, Machine Learning and Deep Learning. 15th International Conference on ICT and Knowledge Engineering. 2017. [Google Scholar]
- Yin W, Kann K, Yu M, Schütze H. Comparative study of CNN and RNN for Natural Language Processing. Comput Sci. 2017;1. [Google Scholar]
- Shi Z, Shi M, Li C. The prediction of character based on Recurrent Neural network language model. IEEE/ACIS 16th International Conference on Computer and Information Science (ICIS. 2017. [Google Scholar]
- Tran V, Nguyen K, Bui D. A Vietnamese Language Model Based on Recurrent Neural Network. Eighth International Conference on Knowledge and Systems Engineering. 2016. [Google Scholar]
- Arnold KC, Gajos KZ, Kalai AT. On Suggesting Phrases vs. Predicting Words for Mobile Text Composition. On Suggesting Phrases vs. Predicting Words for ‘Mobile Text. 2016. [Google Scholar]
- Lee J, Dernoncourt F. Sequential Short-Text Classification with Recurrent and Convolutional Neural Networks. . 2016. [Google Scholar]
- Liang M, Hu X. Recurrent Convolutional Neural Network for Object Recognition. IEEE Conference on Computer Vision and Pattern Recognition (CVPR). 2015. [Google Scholar]
- Hassan A, Mahmood A. Deep Learning for Sentence Classification. Appl Technol Conf. 2021. [Google Scholar]
- Shin J, Kim Y, Yoon S. Contextual CNN: A Novel Architecture Capturing Unified Meaning for Sentence Classification. IEEE International Conference on Big Data and Smart Computing (BigComp). 2018. [Google Scholar]
- Yin W, Schutze H. Multichannel Variable-Size Convolution for Sentence Classification. 19th Conference on Computational Language Learning. 2015;1:1603-45. [Google Scholar]
- Sutskever I, Vinyals O, Le QV. A Sensitivity Analysis of (and Practitioners’ Guide to) Convolutional Neural Networks for Sentence Classification. . 2016. [Google Scholar]